IMPACTS
While seafood fraud has been documented, we still know very little about its potential impacts.
Current evidence for impacts of mislabeling is limited, equivocal, and largely anecdotal.
It is possible that mislabeling could not result in negative outcomes. For example, a substitute product could come from a fishery with the same or better population or management status than the expected product on the label.
Yet, negative outcomes from seafood mislabeling are suspected to be substantial and pervasive as seafood is the world’s most highly traded food commodity.
Is seafood mislabeling having impacts on marine populations and fisheries management?
With our colleagues, we conducted an empirical systems-level analysis to test if the enabling conditions exist for seafood mislabeling in the United States to lead to negative impacts.
What did we learn?
We combined, synthesized, and analyzed data from multiple sources to identify mislabeling pairs and estimate the mislabeled apparent consumption for pairs of seafood products that have been documented to be involved in mislabeling in the United States.
We then examined whether substitute products are more likely to be imported than the expected product on the label, as well as differences between aquaculture and wild-caught products.
We then used the Monterey Bay Aquarium Seafood Watch program assessment scores for wild-caught products to examine whether there are systematic differences between expected and substitute products. In particular, we looked at differences in scores associated with population outcomes on the target species and bycatch, as well as scores associated with management effectiveness and ecosystem impacts.
Findings
Mislabeling and consumption determine how much mislabeled seafood is present.
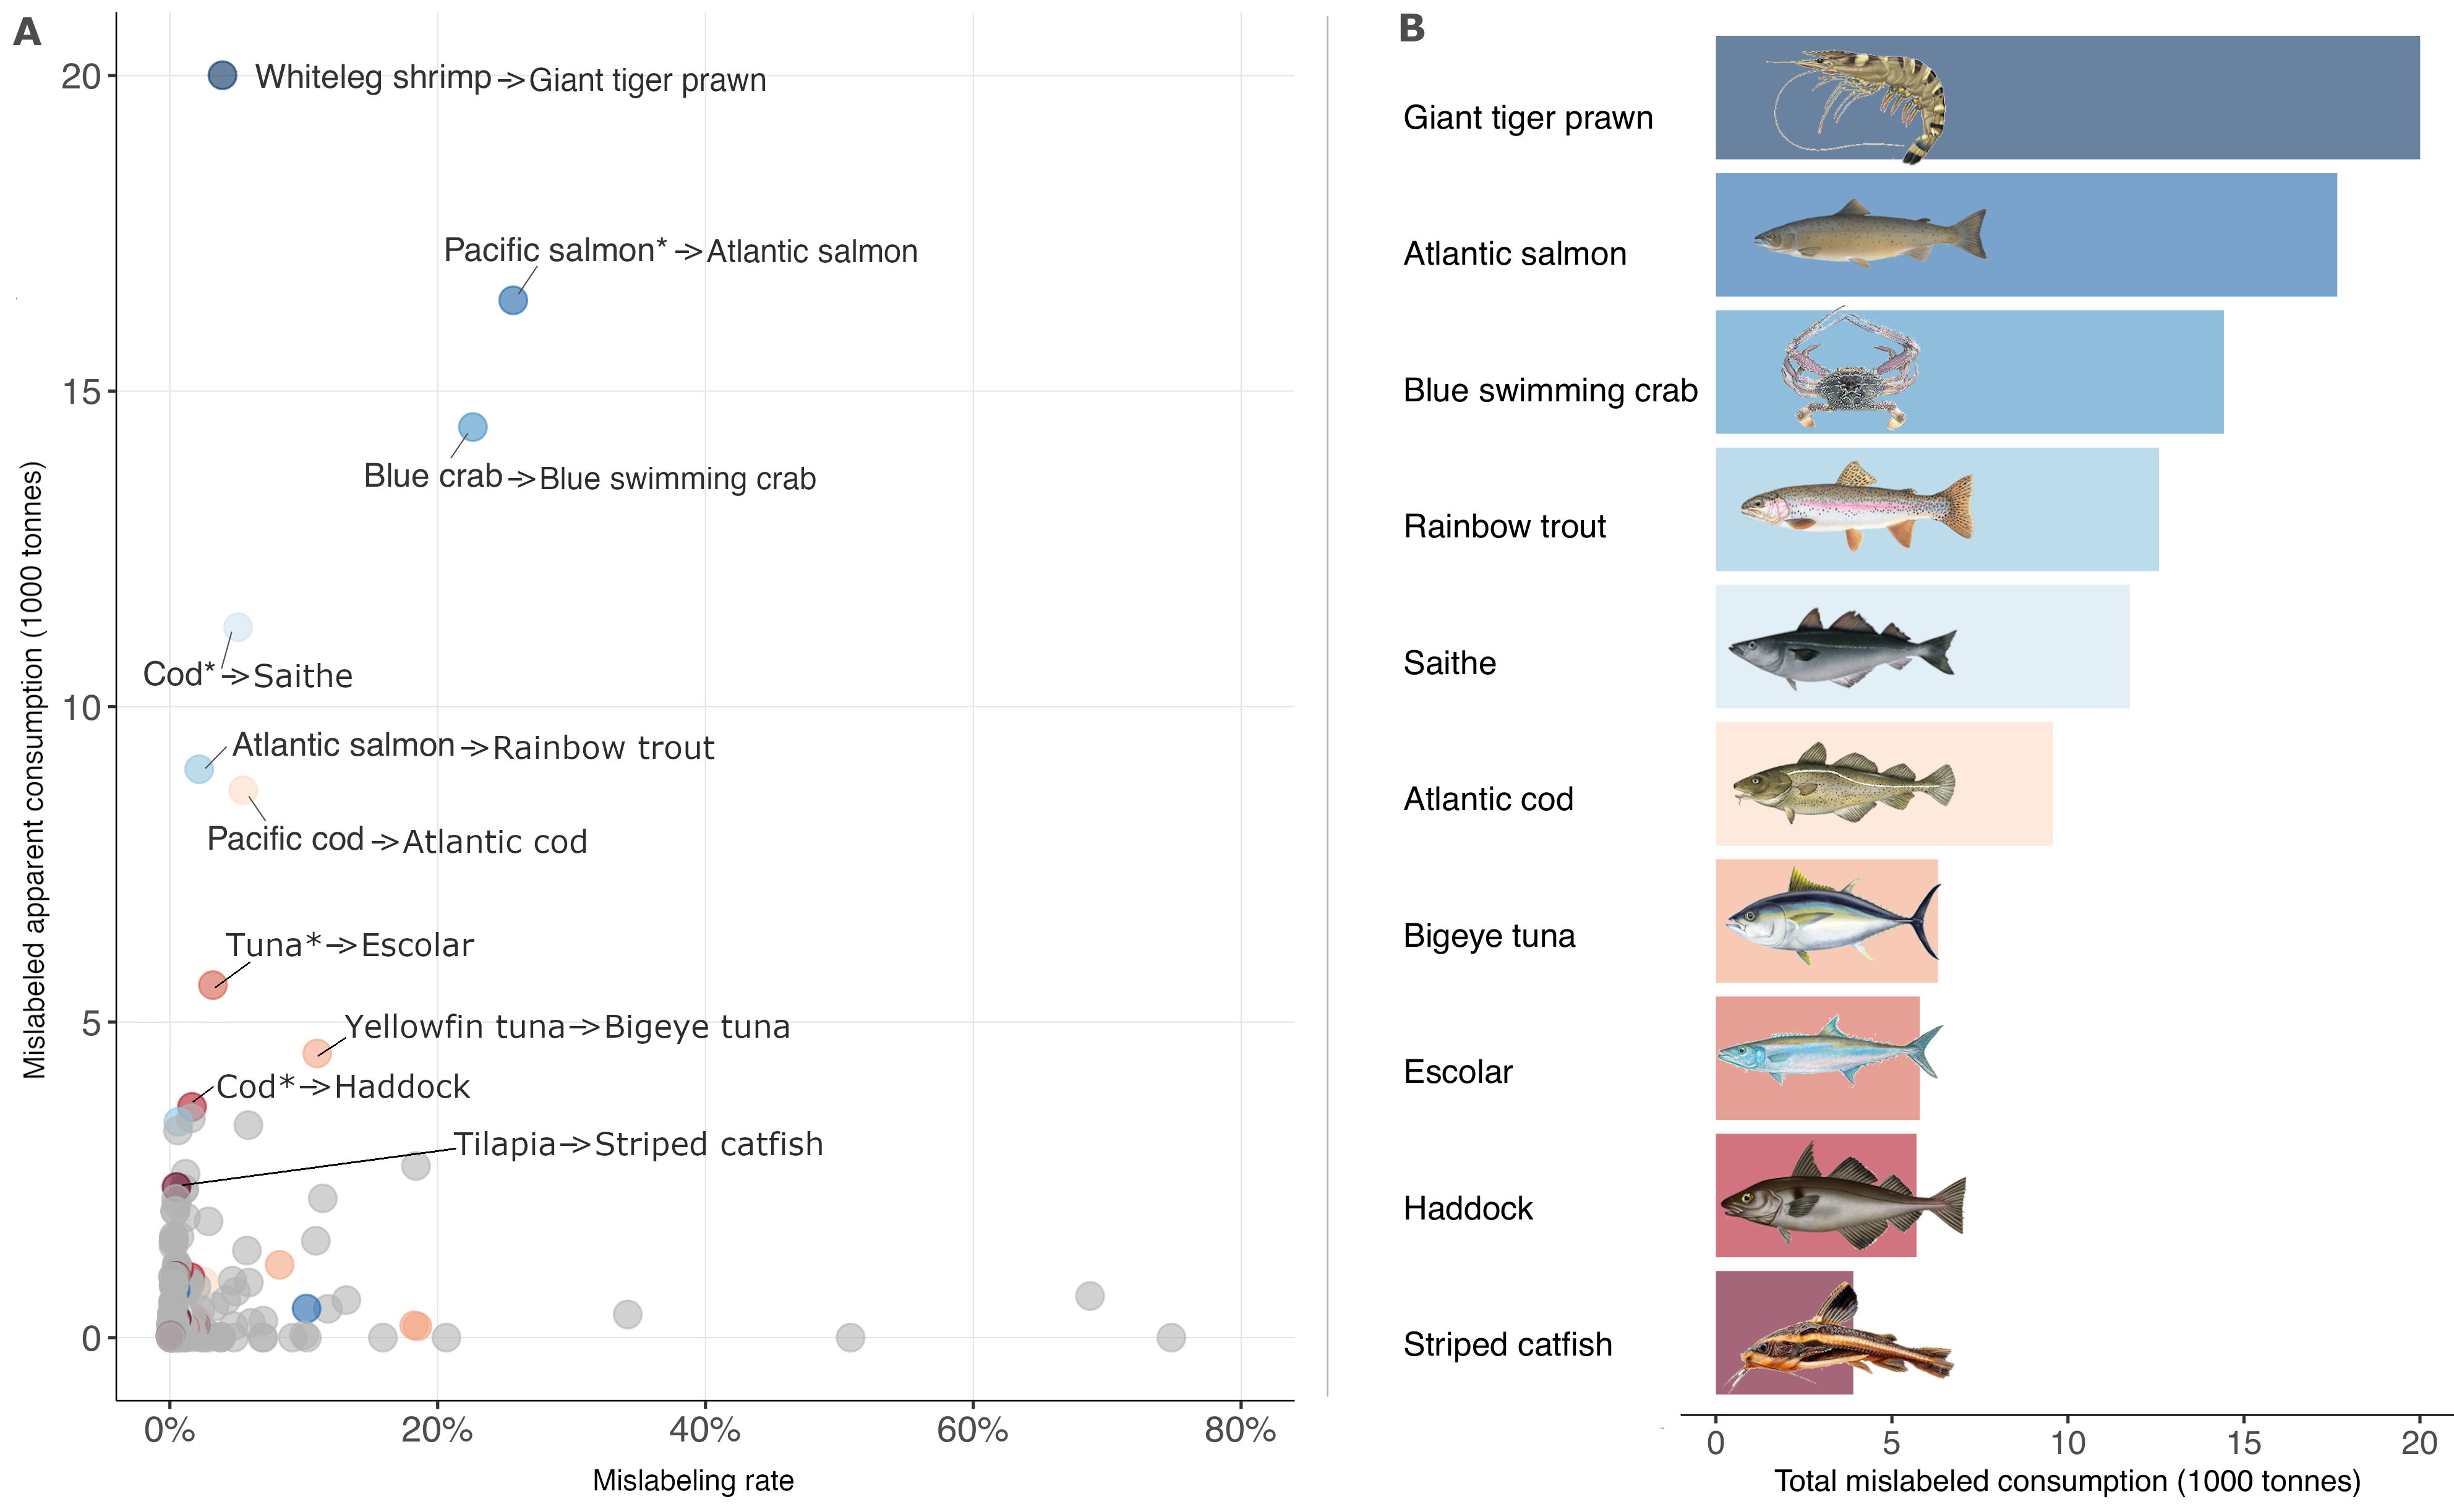
Mislabeling rates and mislabeled apparent consumption (i.e., how much is sold and consumed) are not correlated. Seafood products with high rates have low consumption and vice versa. The majority of seafood pairs (i.e., the substitute product and the expected, or labeled, product) have relatively low mislabeling rates and low consumption. But in sum, somewhere between 420-550 million pounds of seafood is being consumed every year in the US, which exceeds total seafood landings of all but three ports in the United States.
The dynamics of seafood mislabeling are global and involve both wild-caught and aquaculture products.
Substituted products are more likely to be imported than the product listed on the label. However, a substitute product is most likely to originate from the U.S. compared to any other single country, followed by Canada, Indonesia, Chile, and India. Approximately 60% of U.S. mislabeled apparent consumption involves only products that are wild-caught, both the expected and substitute products.
Seafood mislabeling is having negative consequences for marine populations and fisheries management.
For seafood mislabeling where the expected and substitute products are from wild-caught fisheries, evidence suggest negative impacts are occurring. Compared to the product on the label, substituted products come from fisheries with less healthy stocks and greater impacts on bycatch species. Similarly, compared with the labeled product, substituted products are from fisheries with less effective management and with management policies less likely to mitigate impacts of fishing on habitats and ecosystems.
Mislabeling and apparent consumption for the U.S. seafood supply
A) Estimated mislabeling rates and mislabeled apparent consumption for pairs of seafood products where the expected product has been tested for mislabeling in the U.S. The horizontal axis is the mode mislabeling rate for each pair, while the vertical axis is the resulting apparent mislabeled consumption. Pairs with high mislabeled apparent consumption are labeled to show the expected and substitute products (expected → substitute). Colored points represent pairs that contribute to the substitute products that have the highest total mislabeled consumption in Panel B. B) Of the substitute products that have been identified in the U.S., the top 10 make up 55% of the total estimated mislabeled consumption. The total mislabeled consumption for each substitute product is calculated by grouping the pairs by substitute product and summing the mislabeled apparent consumption. The expected products Pacific salmon*, Cod*, and Tuna* represent more than one species. Common names follow Fishbase and Sealifebase.
The data, methods, and results presented here have been subject to peer-review and published in the scientific journal Proceedings of the National Academy of Sciences.