Below are mislabeling profiles that provide a global snapshot for common seafood products. Explore how much and where they have been tested, the most likely mislabeling rate, and what substitutes have been documented. See the impacts section to learn how rates can influence potential environmental impacts of seafood mislabeling and see the transparency section on how we estimate rates.
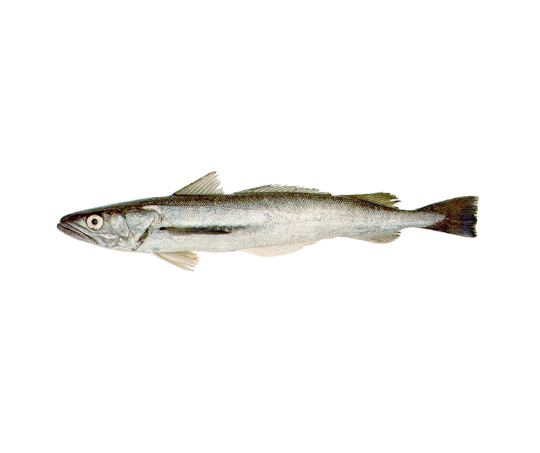
Below are products that have been studied and tested the most. Some products, like northern red snapper and European hake, have high rates of mislabeling. Many, however, have relatively low rates. With the current database, we estimate the global mislabeling rate for any particular fish to be somewhere between 4% and 14%, with 8% being the most likely value. We will be updating our database and expanding our profiles in 2020.